Dedicated Servers
  • Instant
  • Custom
  • Single CPU servers
  • Dual CPU servers
  • Servers with 4th Gen CPUs
  • Servers with AMD Ryzen and Intel Core i9
  • Storage Servers
  • Servers with 10Gbps ports
  • Hosting virtualization nodes
  • GPU
  • Sale
  • VPS
    GPU
  • Dedicated GPU server
  • VM with GPU
  • Tesla A100 80GB & H100 Servers
  • Sale
    Apps
    Cloud
  • VMware and RedHat's oVirt Сlusters
  • Proxmox VE
  • Colocation
  • Colocation in the Netherlands
  • Remote smart hands
  • Services
  • Intelligent DDoS protection
  • Network equipment
  • IPv4 and IPv6 address
  • Managed servers
  • SLA packages for technical support
  • Monitoring
  • Software
  • VLAN
  • Announcing your IP or AS (BYOIP)
  • USB flash/key/flash drive
  • Traffic
  • Hardware delivery for EU data centers
  • About
  • Careers at HOSTKEY
  • Server Control Panel & API
  • Data Centers
  • Network
  • Speed test
  • Hot deals
  • Sales contact
  • Reseller program
  • Affiliate Program
  • Grants for winners
  • Grants for scientific projects and startups
  • News
  • Our blog
  • Payment terms and methods
  • Legal
  • Abuse
  • Looking Glass
  • The KYC Verification
  • Hot Deals

    29.11.2022

    Using the RabbitMQ message broker for monitoring with Prometheus and Grafana

    server one
    HOSTKEY
    Rent dedicated and virtual servers with instant deployment in reliable TIER III class data centers in the Netherlands and the USA. Free protection against DDoS attacks included, and your server will be ready for work in as little as 15 minutes. 24/7 Customer Support.

    Author: Senior Devops. Hostkey Lead Infrastructure Specialist Nikita Zubarev

    In previous articles, we talked about the ELK-RabbitMQ architecture and the Invapi service, which also uses a message broker to communicate with the backend. In any fault-tolerant architecture, proper monitoring with the right notifications is essential. In addition,you don’t only have to monitor the operation of the RabbitMQ cluster, but also to collect metrics and check the number of unread messages. This data can identify a failure in consumer operations in a timely manner, and deliver alerts to the user application that receives messages. Starting from version 3.8.0, RabbitMQ comes with built-in support for Prometheus and Grafana.

    Support for the Prometheus metrics collector comes in the rabbitmq_prometheus plugin. The plugin provides all RabbitMQ metrics on a dedicated TCP port in Prometheus text format. To activate it on a cluster, run:

    rabbitmq-plugins enable rabbitmq_prometheus

    An open port will appear:

    http/promethe: 15692
    us:

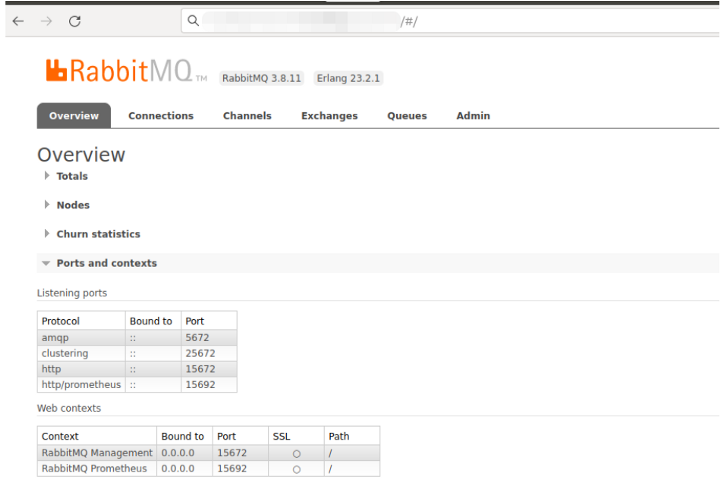
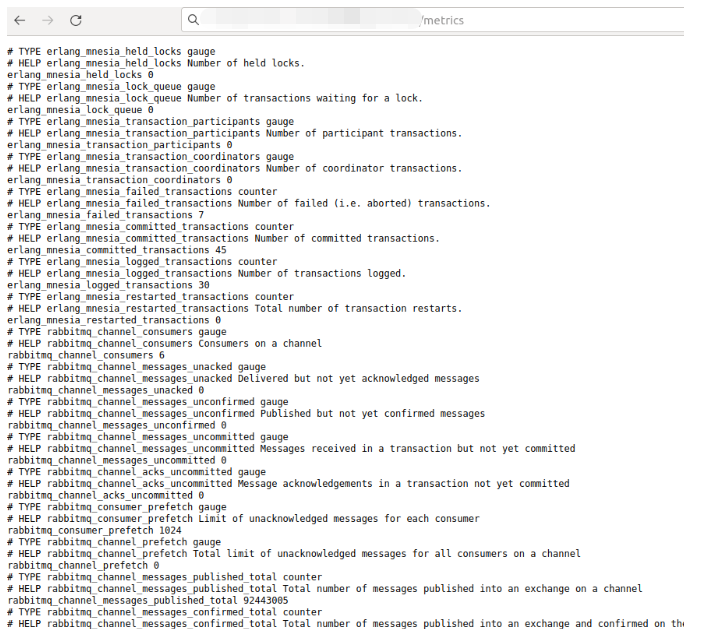
    Checking the metric:

    Add configurations for Prometheus and Alertmanager:

     - job_name: 'RABBIT MQ Prod NL'
    	static_configs:
    		- targets: ['rabbitnl-app01a.infra.hostkey.ru:15692','rabbitnl-app01b.infra.hostkey.ru:15692','rabbitnl-app01c.infra.hostkey.ru:15692']

    The most important thing is the integrity of the cluster and the number of unread messages in the queue.

    If there is more than one unread message in the queue, we send an alert:

      - alert: rabbitmq_queue_messages
    			expr: rabbitmq_queue_messages{job="RABBIT MQ Dev"} > 1
    			for: 1m
    			labels:
    				severity: page
    			annotations:
    				summary: Critical rabbitmq_queue_messages
    	 - alert: unacknowledged messages
    			expr: rabbitmq_queue_messages_unacked{job="RABBIT MQ Prod NL"} > 1
    			for: 1m
    			labels:
    				severity: page
    			annotations:
    				summary: Critical rabbitmq_queue_messages_unacked

    Similarly, we set alerts for the integrity of the cluster.

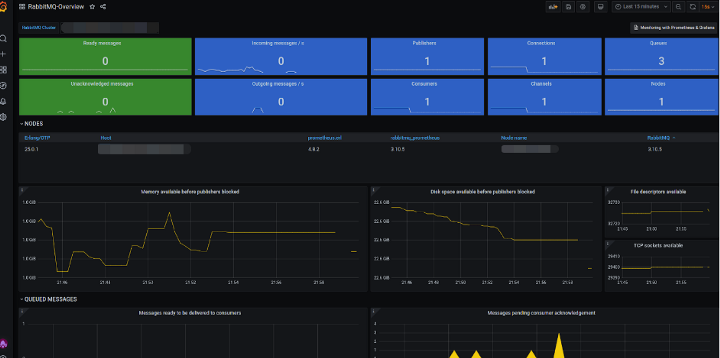
    As mentioned in our first article on monitoring, Grafana has the ability to import a dashboard, simply add id 10991.

    Displayed indicators:

    • Node identification, including RabbitMQ and Erlang/OTP versions.
    • Host memory and disk are available until publishers are locked out (alarm triggers).
    • Host file descriptors and TCP sockets are available.
    • Ready and pending messages.
    • Incoming message frequency: published / redirected to queues / acknowledged / not acknowledged / returned / discarded.
    • Evaluation of outgoing messages: delivered with automatic or manual confirmation / acknowledged / redelivered.
    • Polling operation with automatic or manual confirmation, as well as with empty operations.
    • Queues, including add and delete rates.
    • Channels, including opening and closing levels.
    • Connections, including open and closed channels.

    If needs be, further parameters can be added to the list (we will discuss how to create templates in the following articles).

    Thus, RabbitMQ monitoring tools allow you to check the overall performance of the node, as well as ready and unacknowledged messages. An important advantage of our solution is the multifaceted and operational monitoring of your equipment conditions.

    Rent dedicated and virtual servers with instant deployment in reliable TIER III class data centers in the Netherlands and the USA. Free protection against DDoS attacks included, and your server will be ready for work in as little as 15 minutes. 24/7 Customer Support.

    Other articles

    01.05.2024

    Checklist: 10 Points to Choose a Hosting Service That Won't Let You Down

    How to choose the best hosting for your projects? We have prepared a checklist of 10 questions you should ask the hosting service that will help you make a decision.

    17.04.2024

    How to choose the right server with suitable CPU/GPU for your AI?

    Let's talk about the most important components that influence the choice of server for artificial intelligence.

    04.04.2024

    VPS, Website Hosting or Website Builder? Where to host a website for business?

    We have compared website hosting options, including VPS, shared hosting, and website builders.

    15.03.2024

    How AI is fighting the monopoly in sports advertising with GPUs and servers

    AI and AR technologies allow sports advertising to be customized to different audiences in real time using cloud-based GPU solutions.

    06.03.2024

    From xWiki to static-HTML. How we “transferred” documentation

    Choosing a platform for creating a portal with internal and external documentation. Migration of documents from cWiki to Material for MkDocs

    HOSTKEY Dedicated servers and cloud solutions Pre-configured and custom dedicated servers. AMD, Intel, GPU cards, Free DDoS protection amd 1Gbps unmetered port 30
    4.3 67 67
    Upload